In my previous post, I explained how the microsegmentation from an overview point was like for us.
I want to share the Alert Dashboard code and setup, so you can go ahead and make your microsegmentation project easy and save the time to develop a solution to handle the alerts.
From NSX-T 2.5 you can now get help by the NSX-T Intelligence appliance, which can help you analyze the flows and help you make the necessary firewall rules. We used Network Insight, but if you only are interested in the flows within the virtualized network, you may not need the Network Insight license, and you can go ahead with the NSX-T Intelligence.
The tool is free and licensed under MIT, which means you can contribute to the code. Please be aware that the coding for this project was done very fast, and i just wanted to share the code as is.
Gitlab link to download Tool: https://github.com/sorenisager/nsx-alert-dashboard
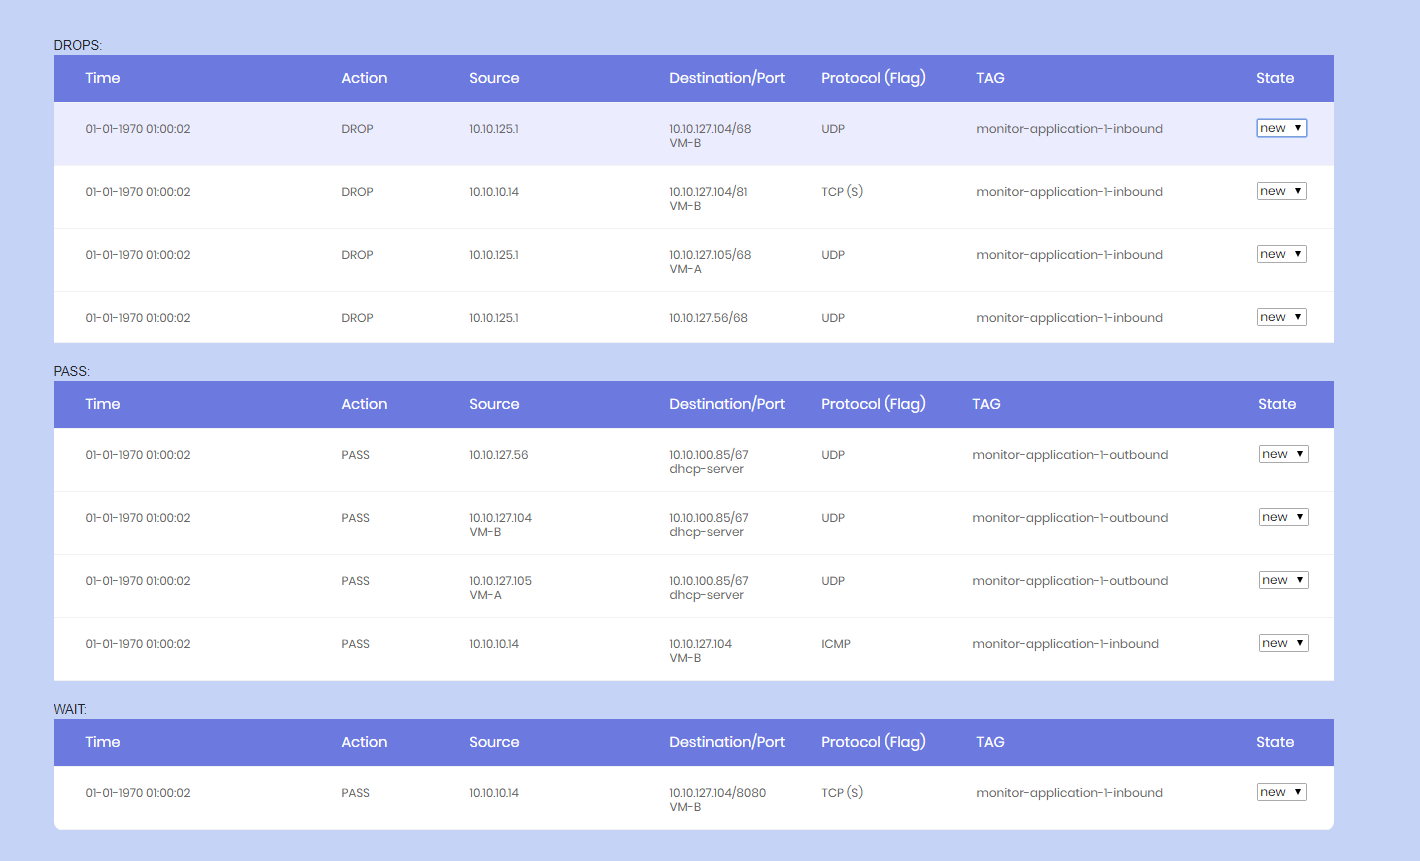
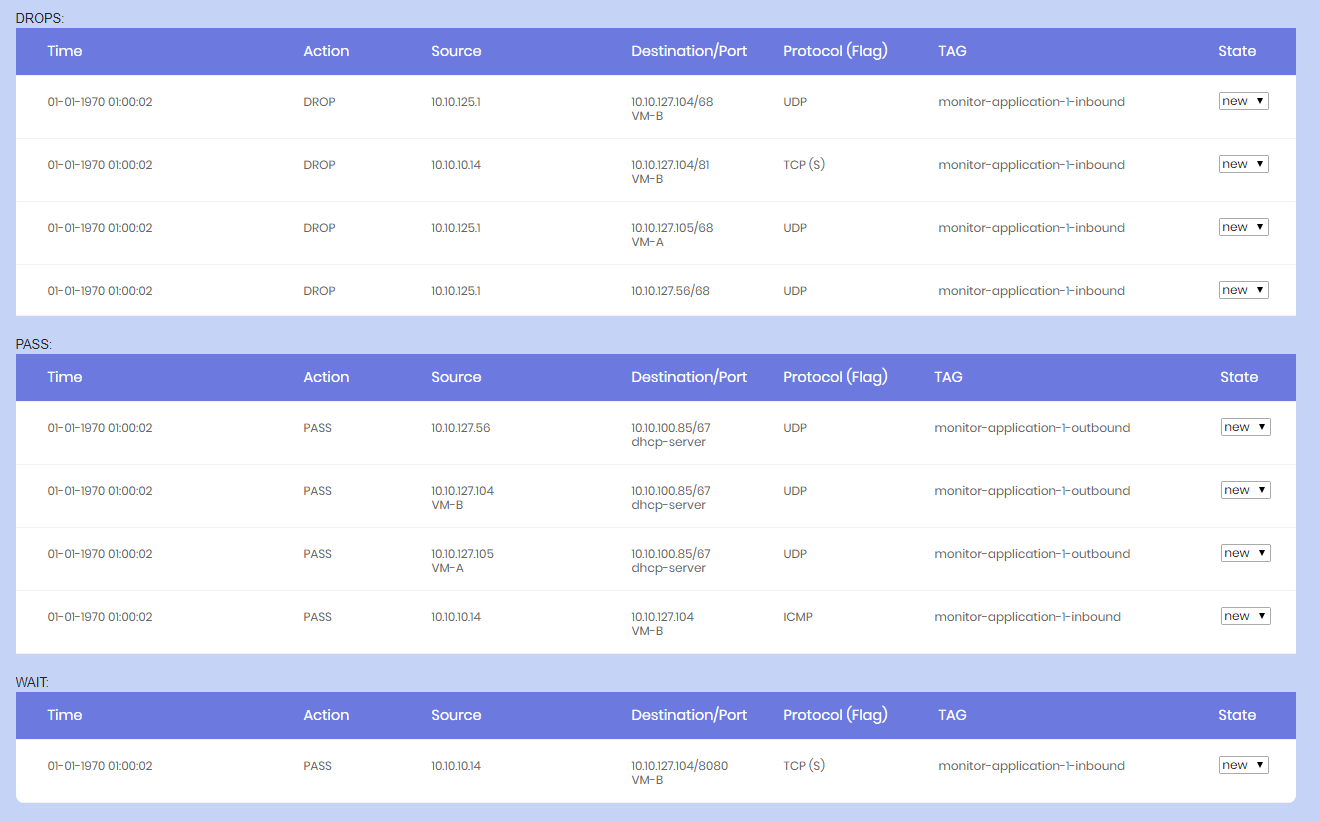
Dashboard looks like:
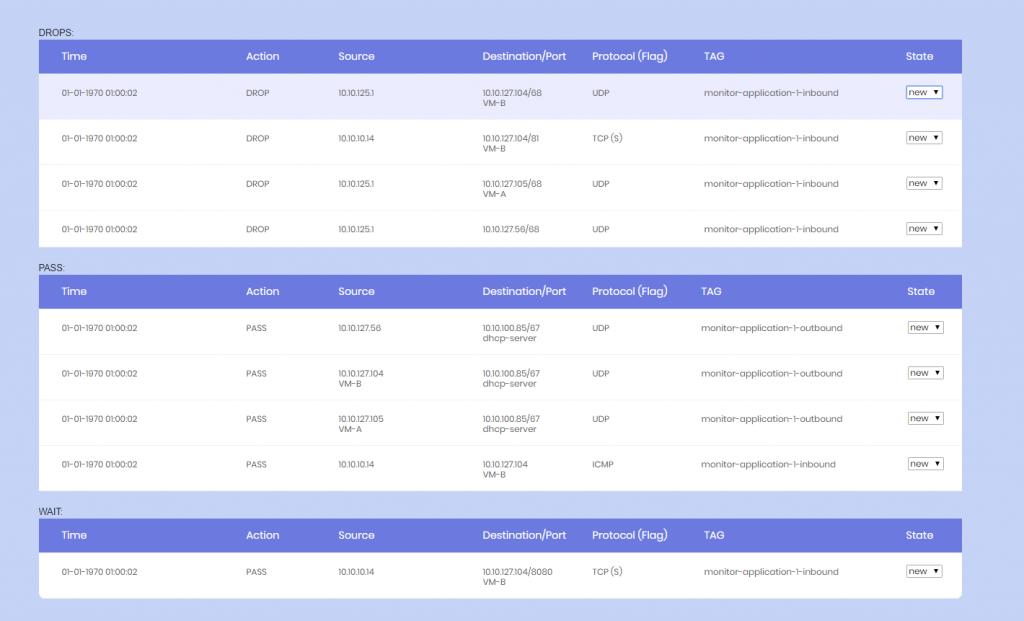
PASS logs was used to find traffic where no firewall rule existed, but wasn’t enforced
DROP logs is after the “enforcement” and means that the application is actually hurting because the traffic between servers may not work.
Before the NSX Alert Dashboard can be used, you may need to understand how we handle the NSX rules and how we set up the NSX environment to send the correct logs to the dashboard.
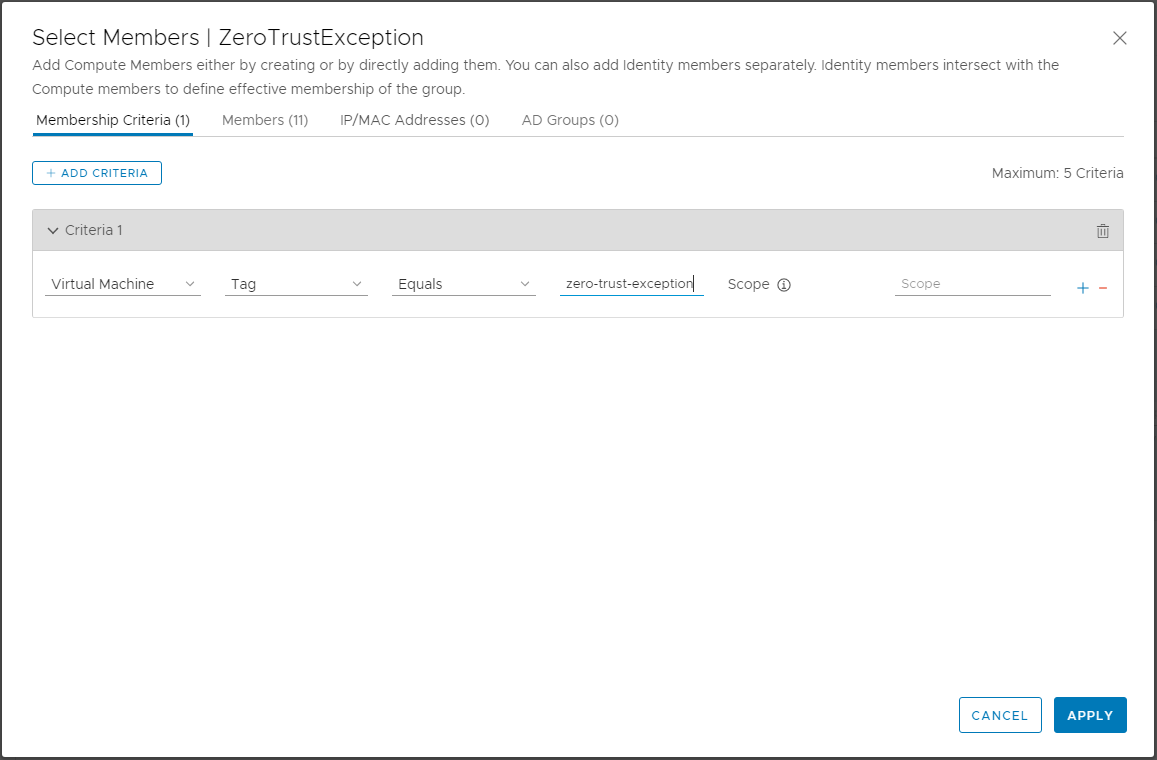
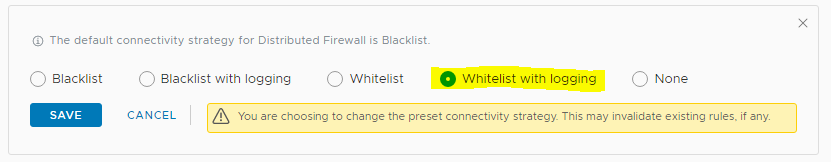
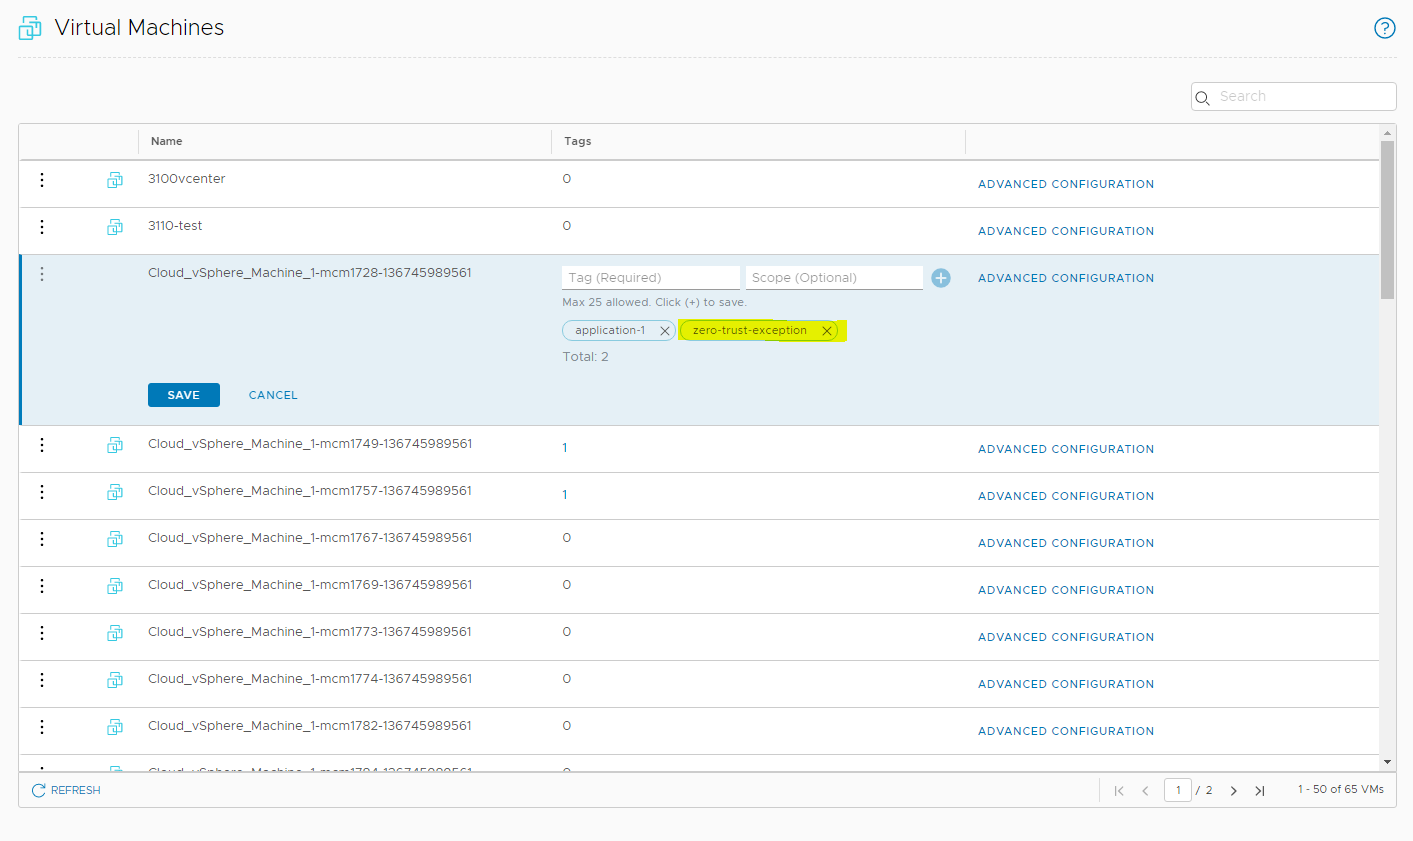
1. Before we implemented our zero-trust strategy and changing the default policy, we made a group object which had the zero-trust-exception tag, so we could tag all virtual machines.
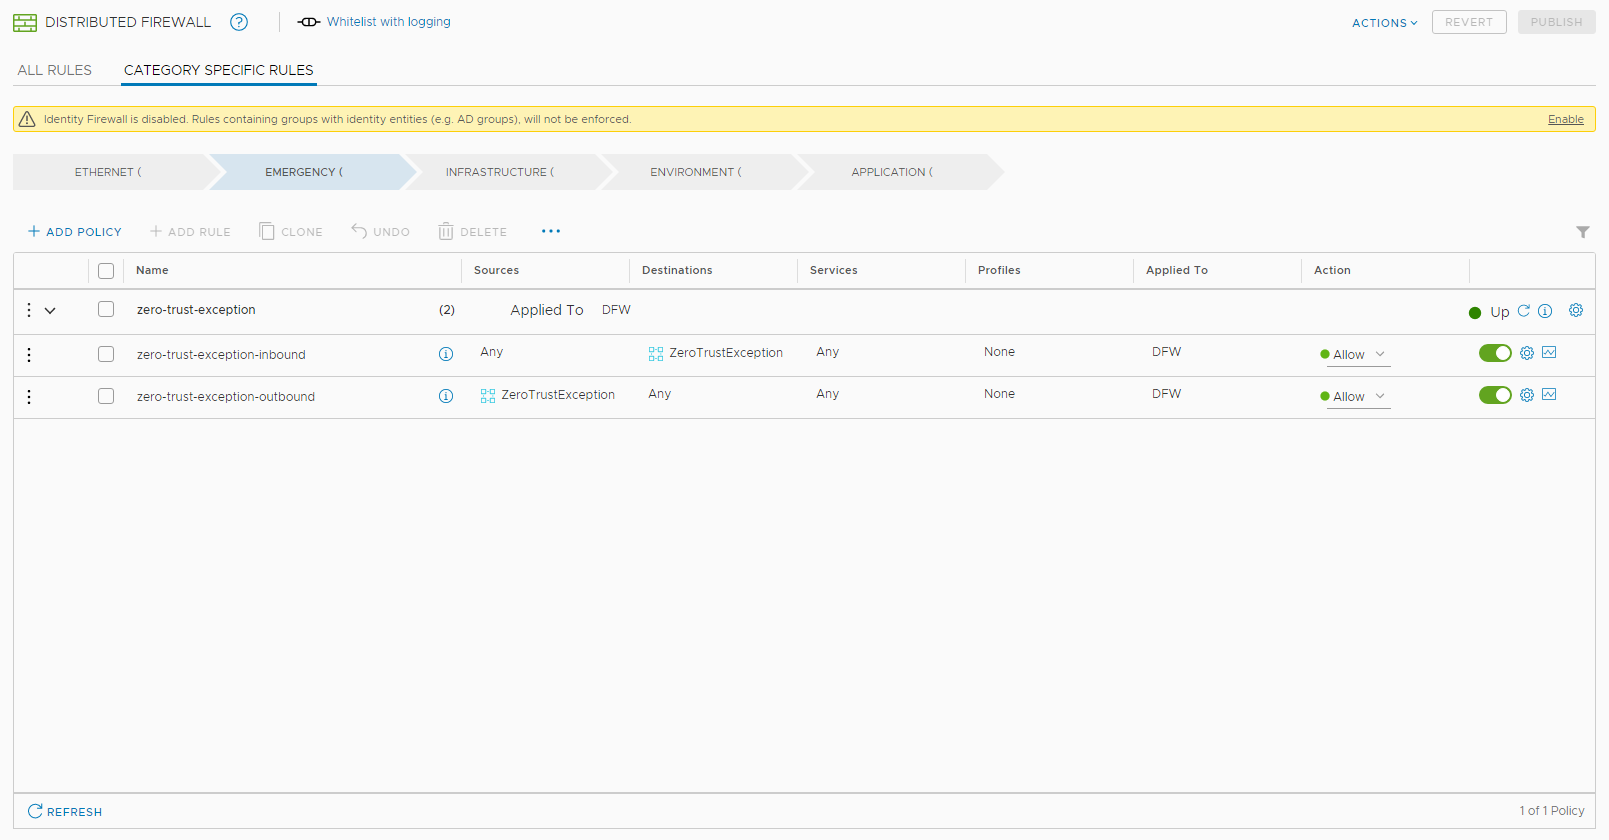
We also added firewall rules, that would allow the communication between all servers, until we were done with segmenting the applications.

2. Our approach was.. Don’t allow anything until it is defined and allowed (Zero-trust)
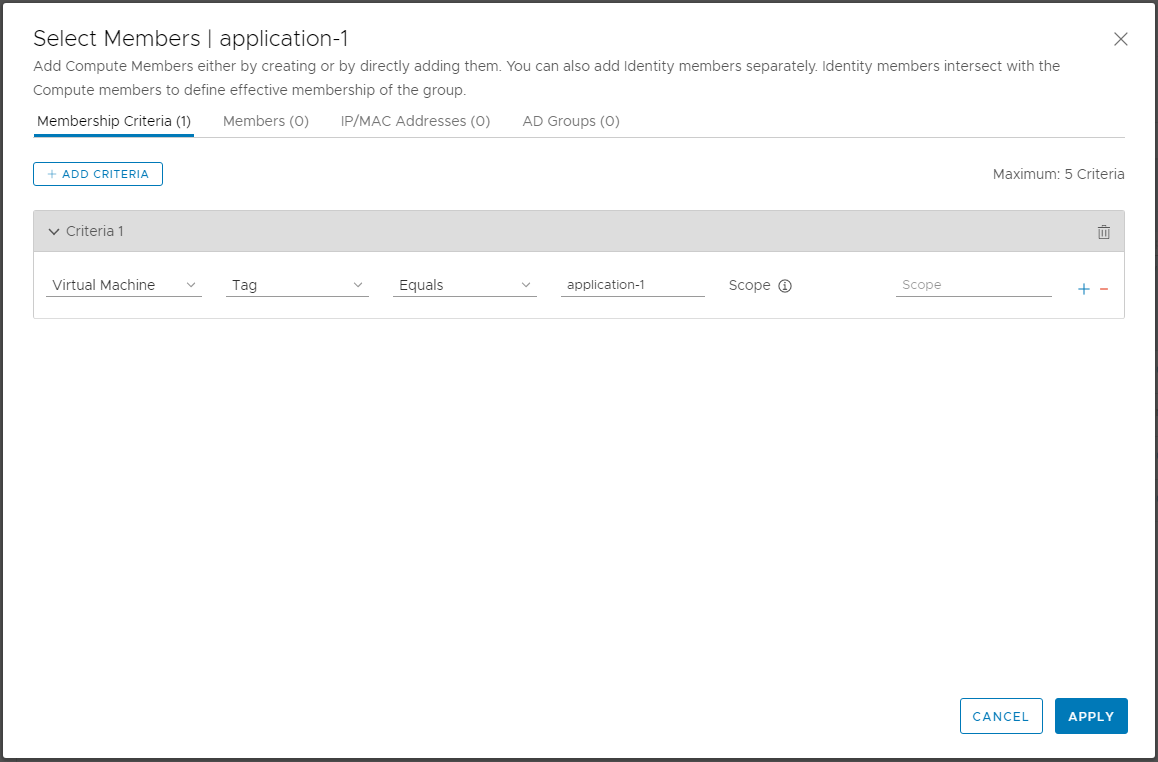
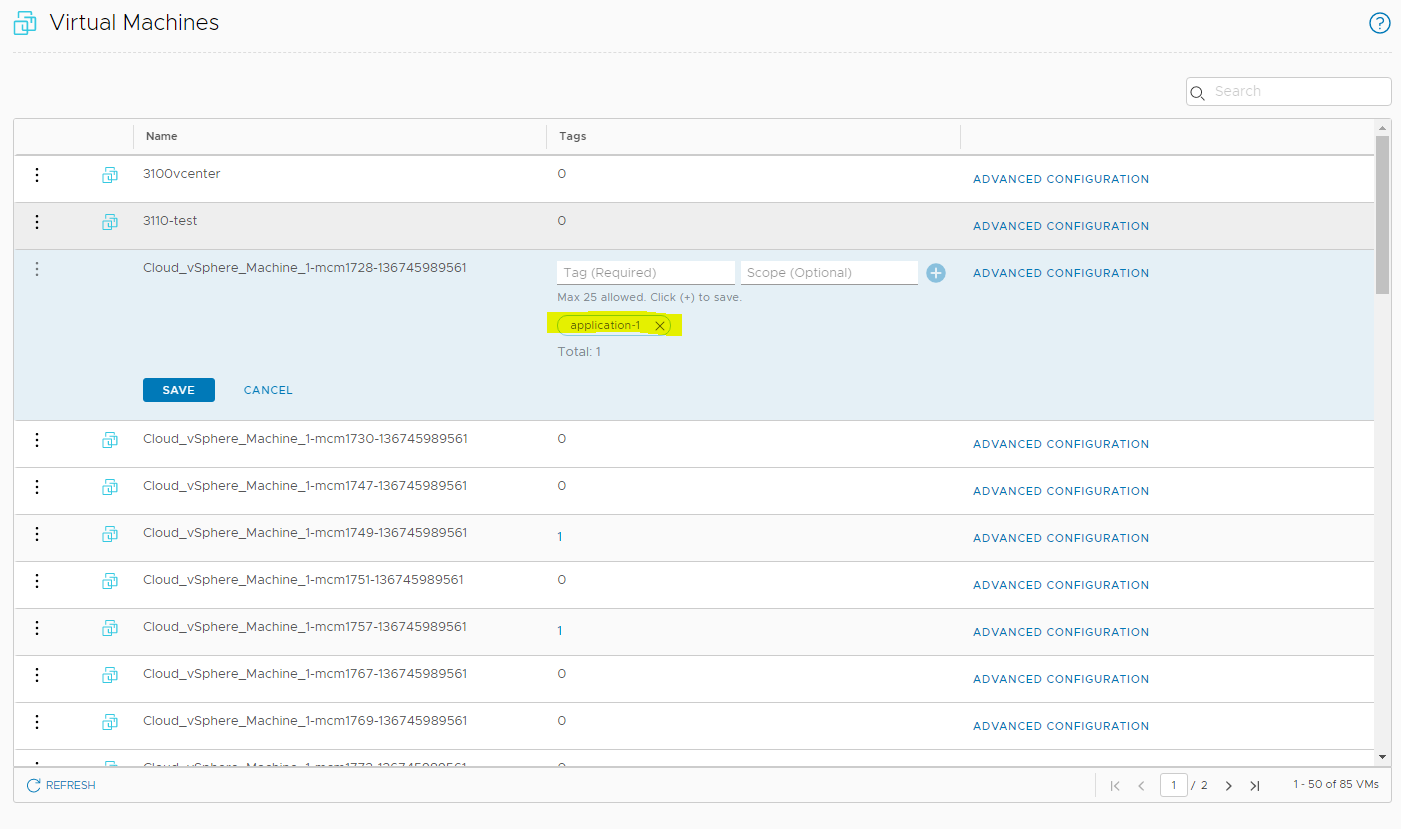
3. Making application groups based on tags, all application-objects need to be tagged to a application-group
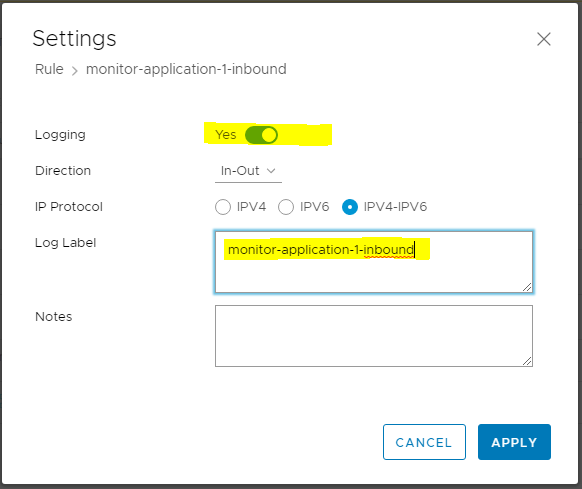
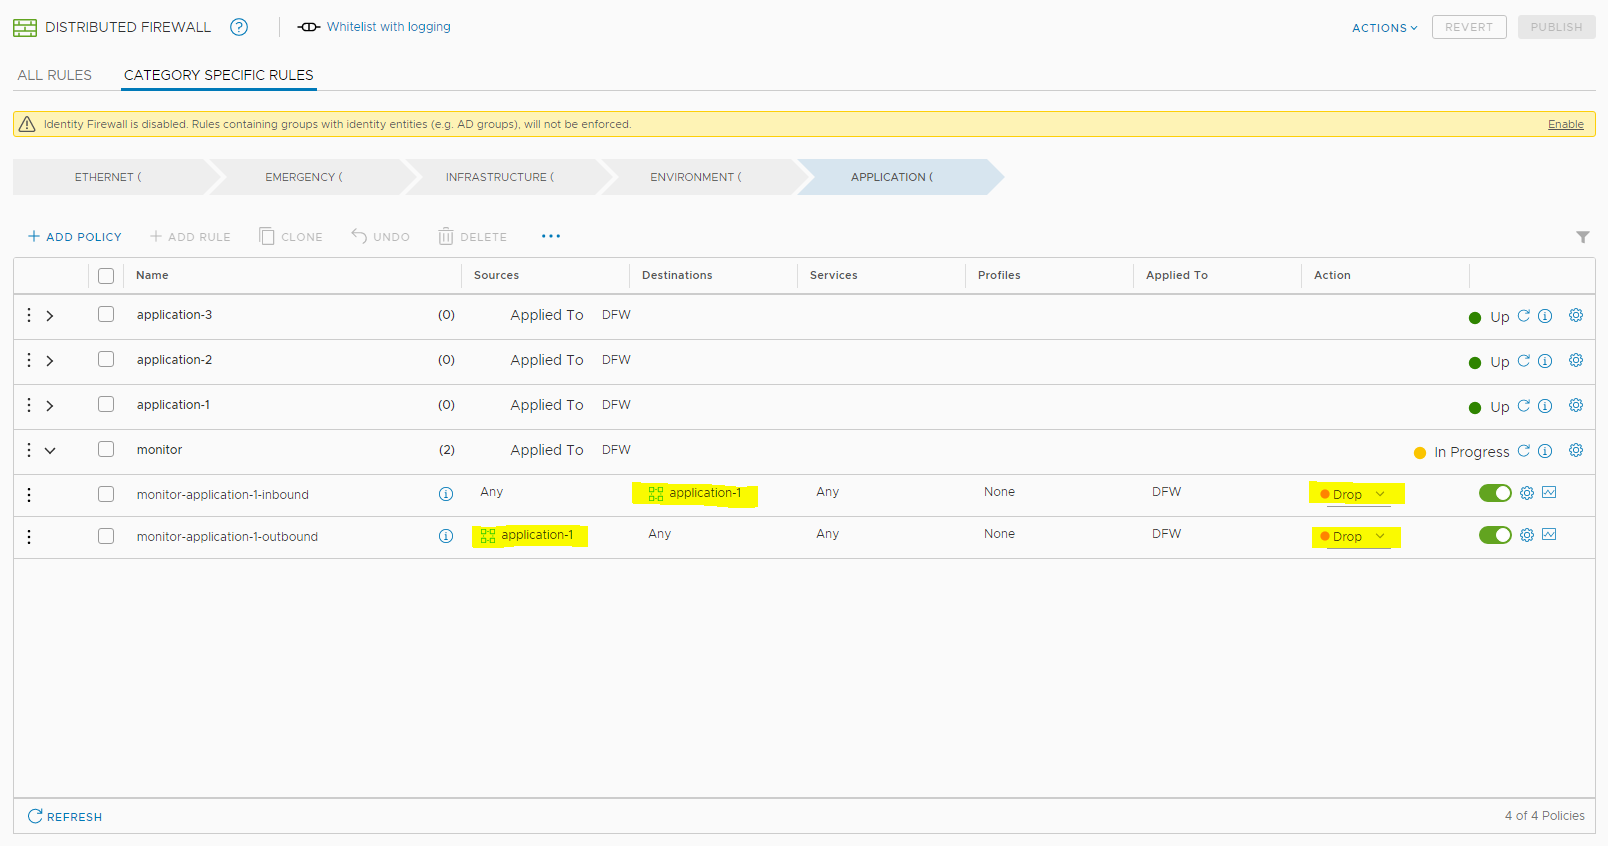
4. Add a “monitor” section in the end of the rule set for the specific application and allow the traffic
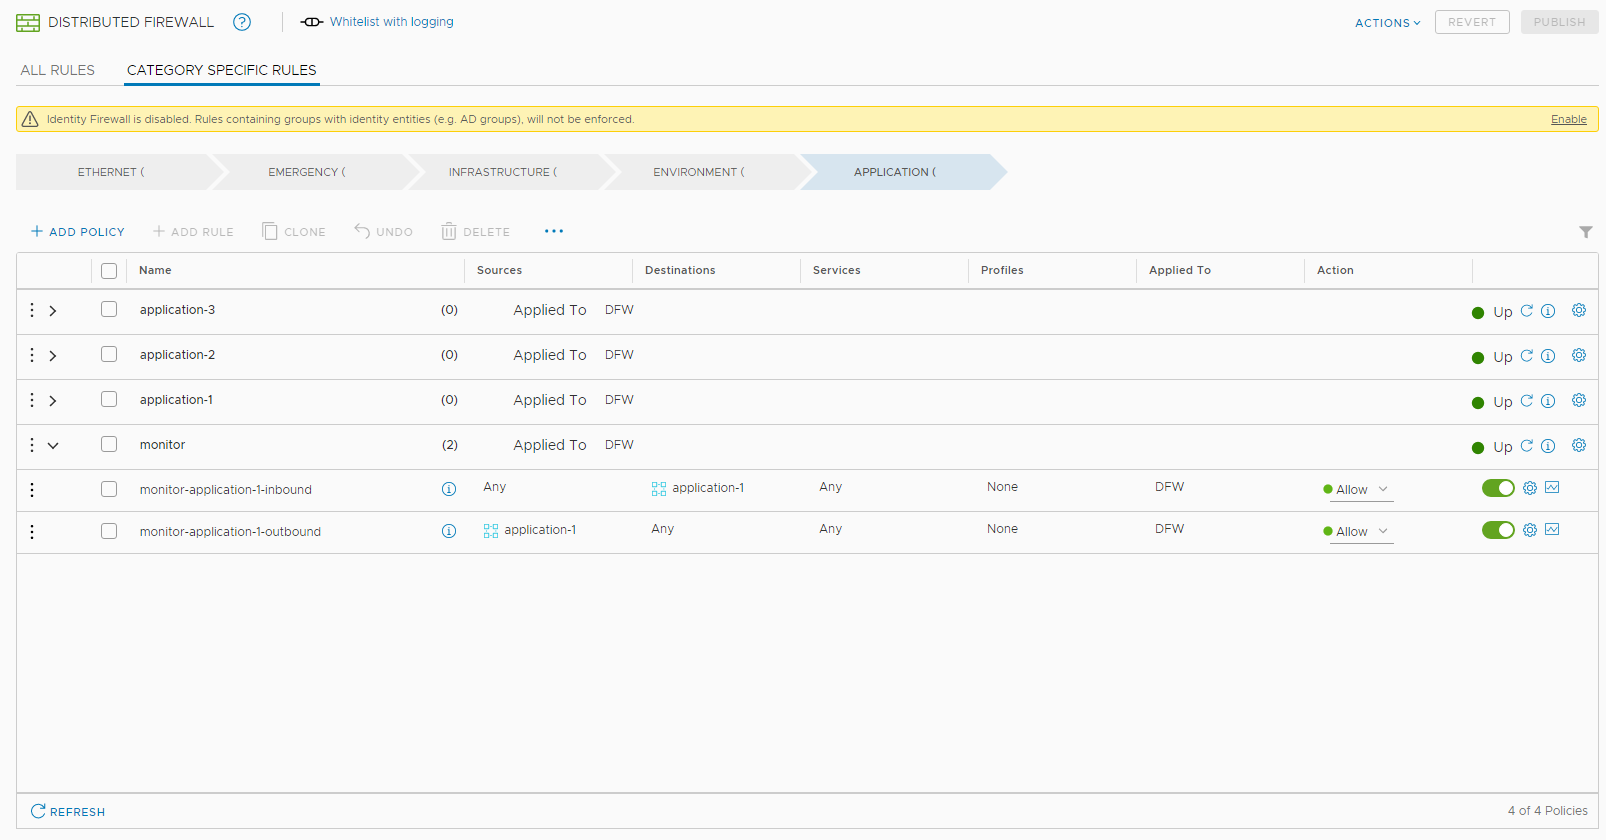
5. Enable logging options
6. Publish rules and then remove the “zero-trust-exception” tag from the VMs in that application. (This means, that all traffic not hitting the zero-trust-exception will hit the monitor-rule and then you will be notified through the alert dashboard (if no rules is hit before in the application specific section)
7. Login to Log Insight and make an interactive search for the tag: monitor-*
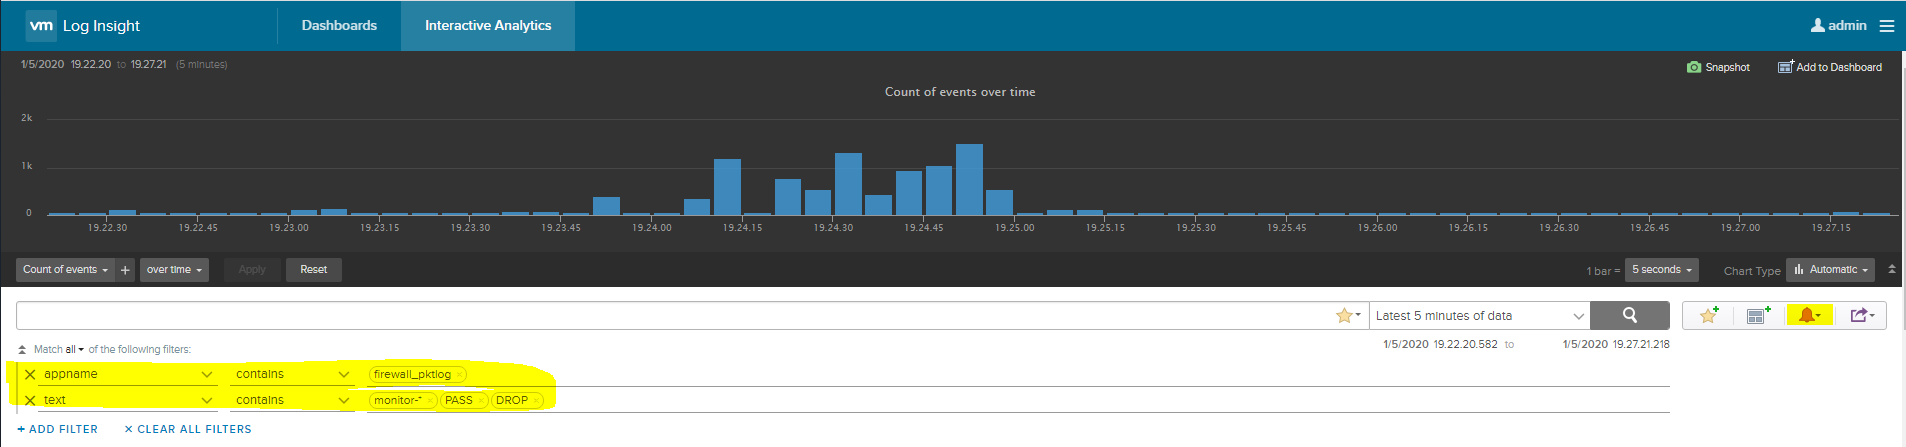
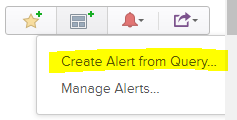
8. Create alert based on the query you just searched for
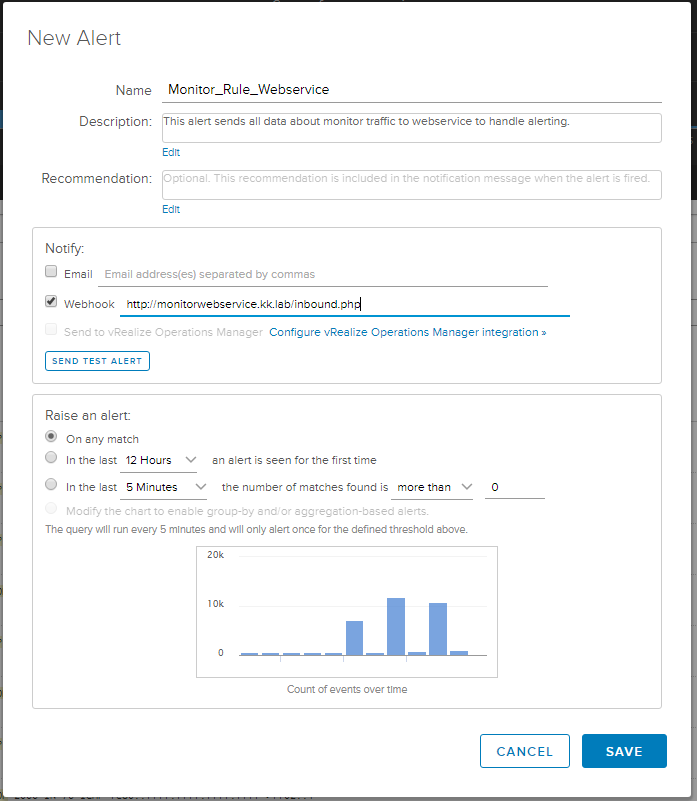
Could be: http(s)://10.10.100.33/inbound.php (Download and install the github repo)
9. You will now see logs if everything is setup correctly and you have PASS’es
10. Fix the alerts, make a agreement with the system owner. Do the “enforcement” by changing the monitor rule from PASS to DROP
This means, the application now only allow traffic that is specified in rules higher than the monitor-rule section.
Please be aware that all traffic will not be fixed by first hand, as some other applications may still have the zero-trust-exception and is allowed to talk to your application but you will never see this as the rule is on the top. You are first “really finish” when all virtual machines is microsegmented, but you can do some enhancements by adding rules higher than the zero-trust-exception that says application traffic from 01 to 02 is NOT allowed.
11. Fix the alerts for the next 14 days and then disable the monitor section or maybe just remove it, then you’re done with the microsegmentation of that application.


Hi Soren ,
Sounds interesting. Another approach ,which we use in Vestas , is to have combinations of AutoNSX software from digITout.net (https://digitout.net/services/autonsx/) and run vRNI is assessment mode for free with in 60 days(everyone can download it from VMWARE site) and do segmentation in with a simple workflow migration.
Hi Dmitri,
Thanks for your comment, I appreciate it!
Smart product, can you define approval process before the auto implementation? In our microsegmentation project we did find servers doing some traffic that did not comply with the compliance. we identified those “bad” servers through the manual process, but sure i will suggest doing something smarter!
My point is, even if the product help you do the creation of rules, do you verify the traffic and only open for the traffic that comply to your security policies?
Have you taken a look at NSX Intelligence? This may also help you identify the traffic flows.
Thanks again.
Best Regards
Søren
Hi Soren, good points!
definition of what is “bad” what is good is more of an Architectural task. I’m not sure what you mean by “verify the traffic”. AutoNSX allows you to define specific traffic rules if needed.
Luckily enough they now build compliance functionality to identify such traffic patterns by utilizing a build-in flow collector, which is coming as the next release feature. Then you don’t need vRNI because the user can use the collector in case if there is no money for vRNI.
About NSX Intelligence – yes it is good and Enterprise Plus license required. Heavy on resources. I would say depends on what the organization wants
AutoNSX is a tiny VM with all necessary functionality for micrsoegmentation use cases. But again Pros & Cons. AutoNSX has interesting features to come next few releases. We use it and DevOps are truly happy with the functionality, for example, SNOW integration.